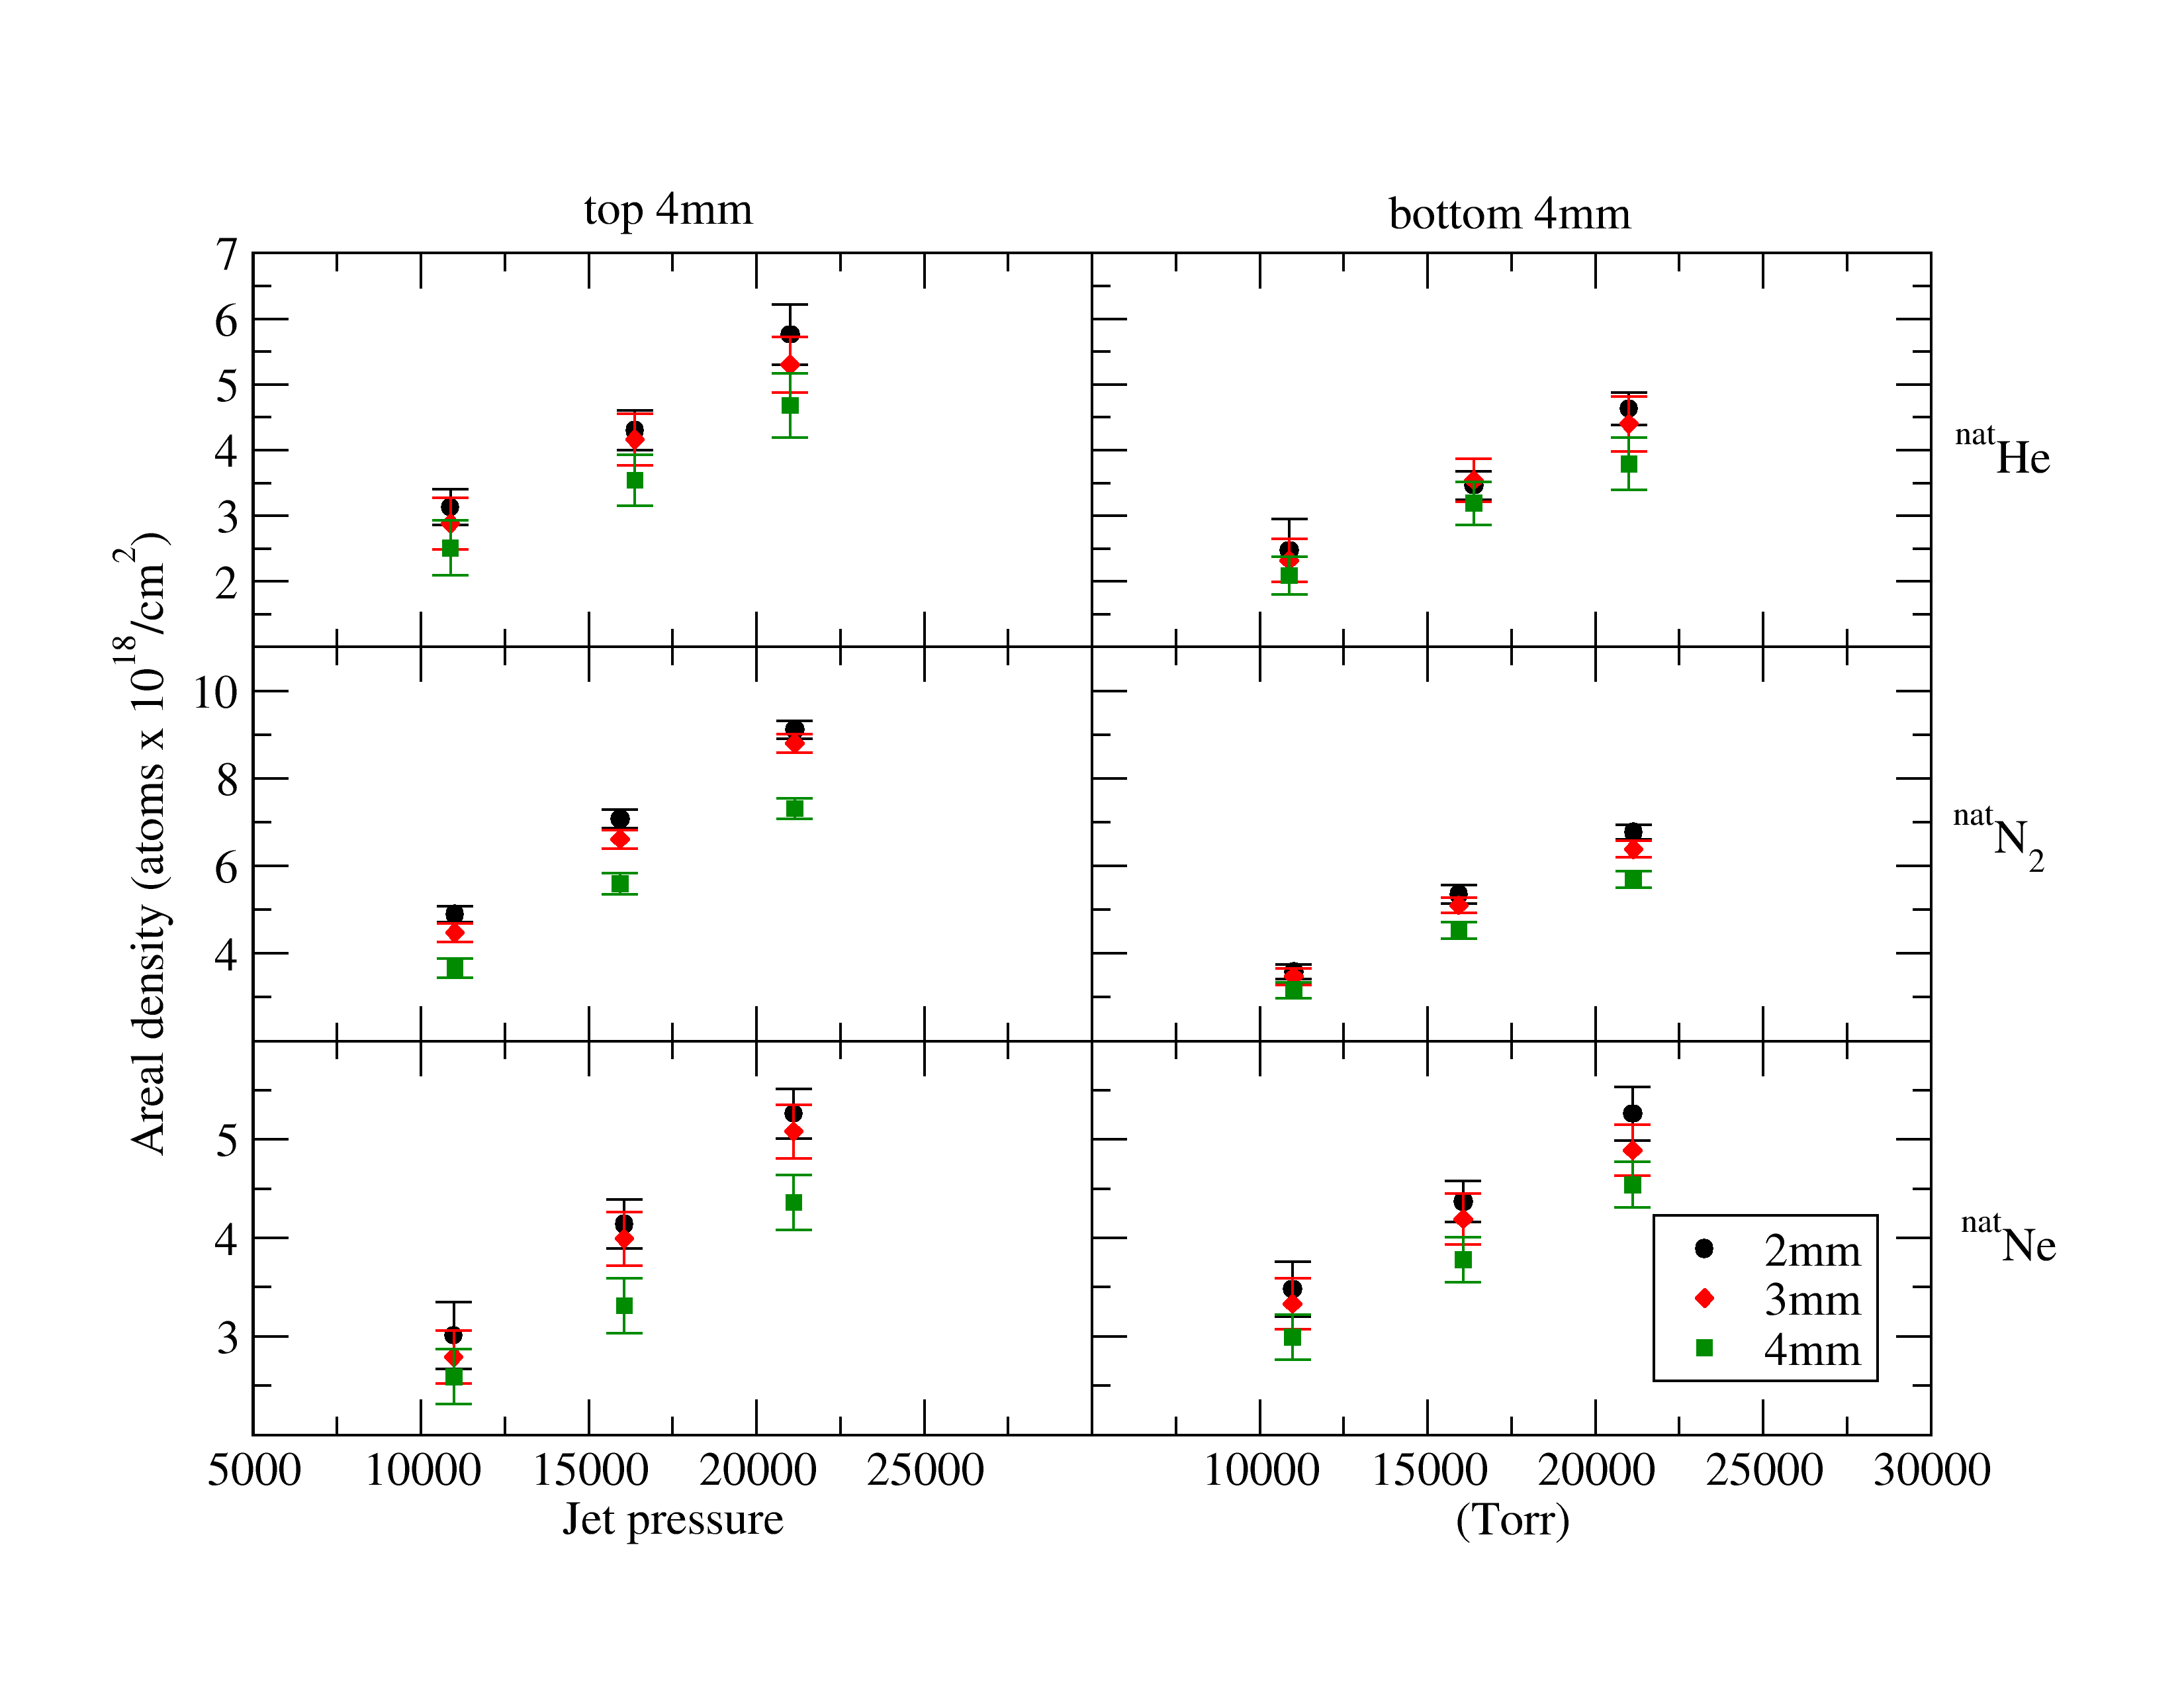
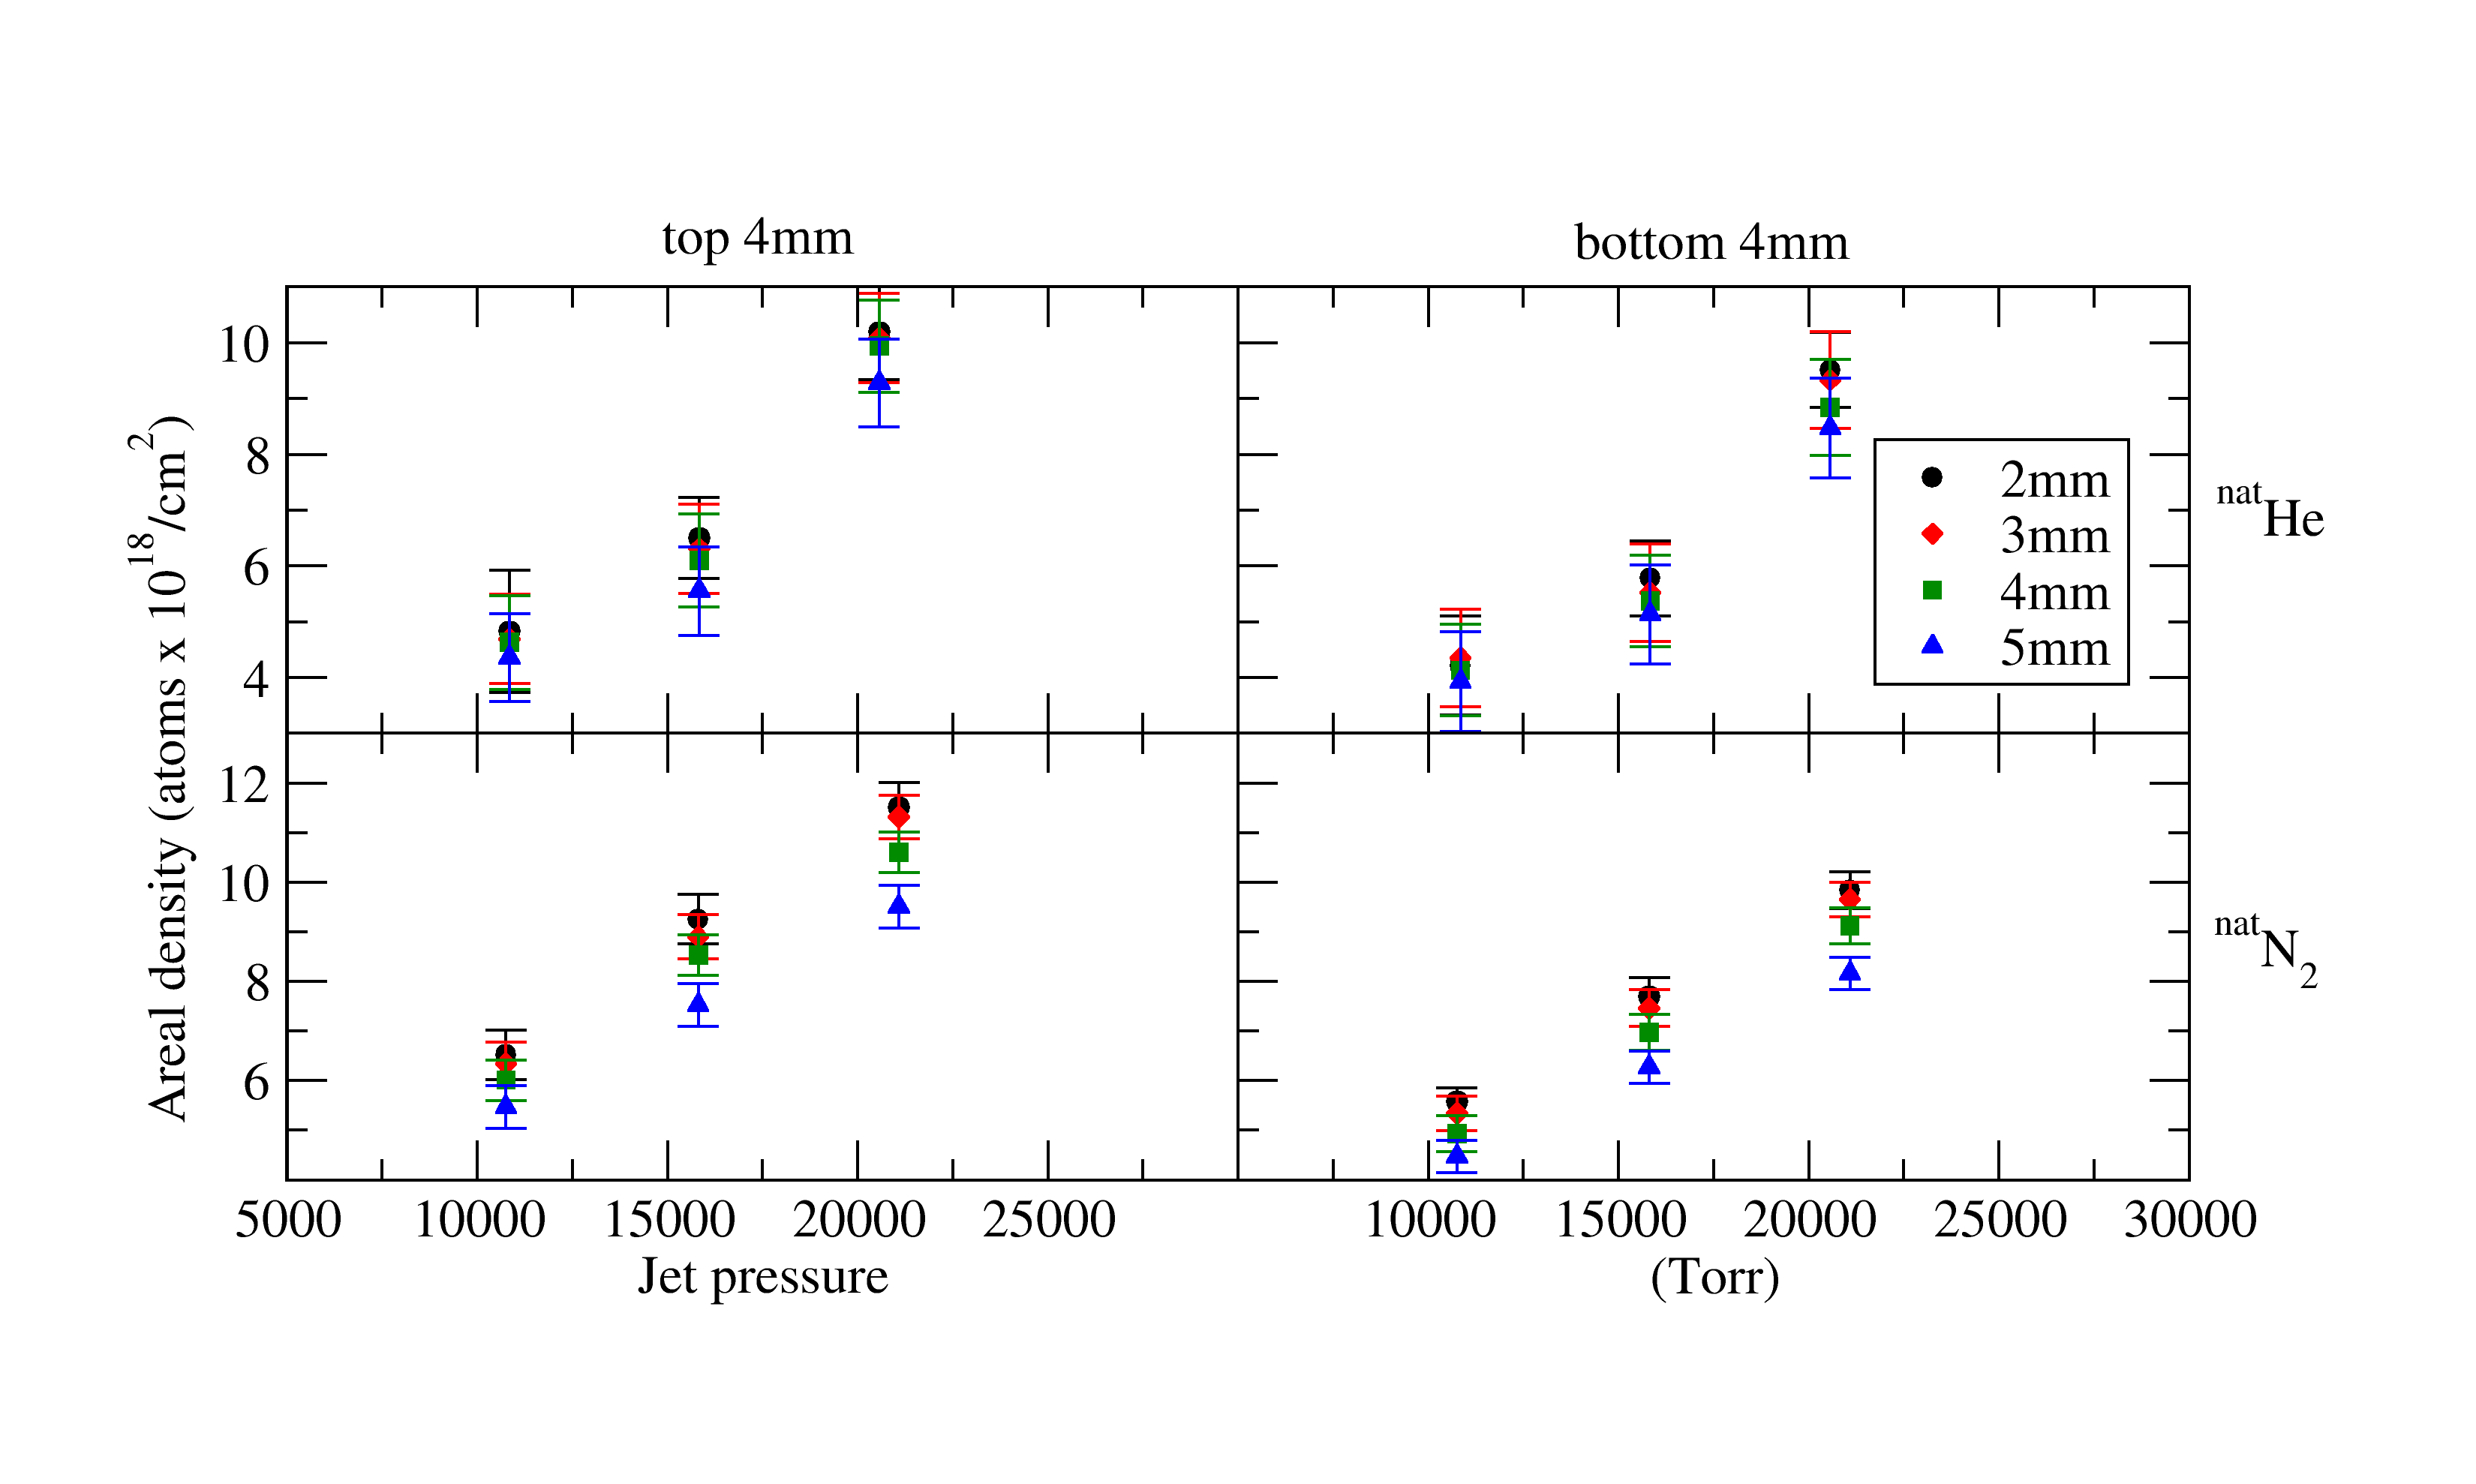
Jet areal densities versus jet inlet pressure for Jet Nozzle B, for the two gas species teste with this jet nozzle. The left panels represent the density in the “top” ∼4mm of the jet, and the right panels show. the ∼4mm below this. The black dots indicate the average areal density over the central 2mm width of the jet, the red diamonds are the central 3mm of the jet, the green squares are the central 4mm of the jet, and the blue triangles are the average density over the entire 5mm width of the jet.